% the fft-based spectra
NN=2048; th=linspace(0,2*pi,NN);
Y =abs(fft(y,NN))/sqrt(N);
Y = Y.^2;
plot(th,Y);
FFT-based methods
We begin with two classical formulae. The correlogram is defined as
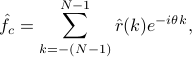
where  denotes an estimate of the covariance lag
  , whereas the periodogram
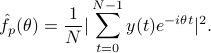
The two coincide when the correlation lag is estimated via

where  . The periodogram can be efficiently computed using the fast Fourier transform (FFT).
There is a variety of methods, such as Welch and Blackman-Tukey methods, designed to improve the performance using lag window functions either in the time domain or in the correlation domain.
In situations when the data length is short, to get a smooth spectrum, we may
increase the data length
by padding zeros to the sequence.
. The periodogram can be efficiently computed using the fast Fourier transform (FFT).
There is a variety of methods, such as Welch and Blackman-Tukey methods, designed to improve the performance using lag window functions either in the time domain or in the correlation domain.
In situations when the data length is short, to get a smooth spectrum, we may
increase the data length
by padding zeros to the sequence.
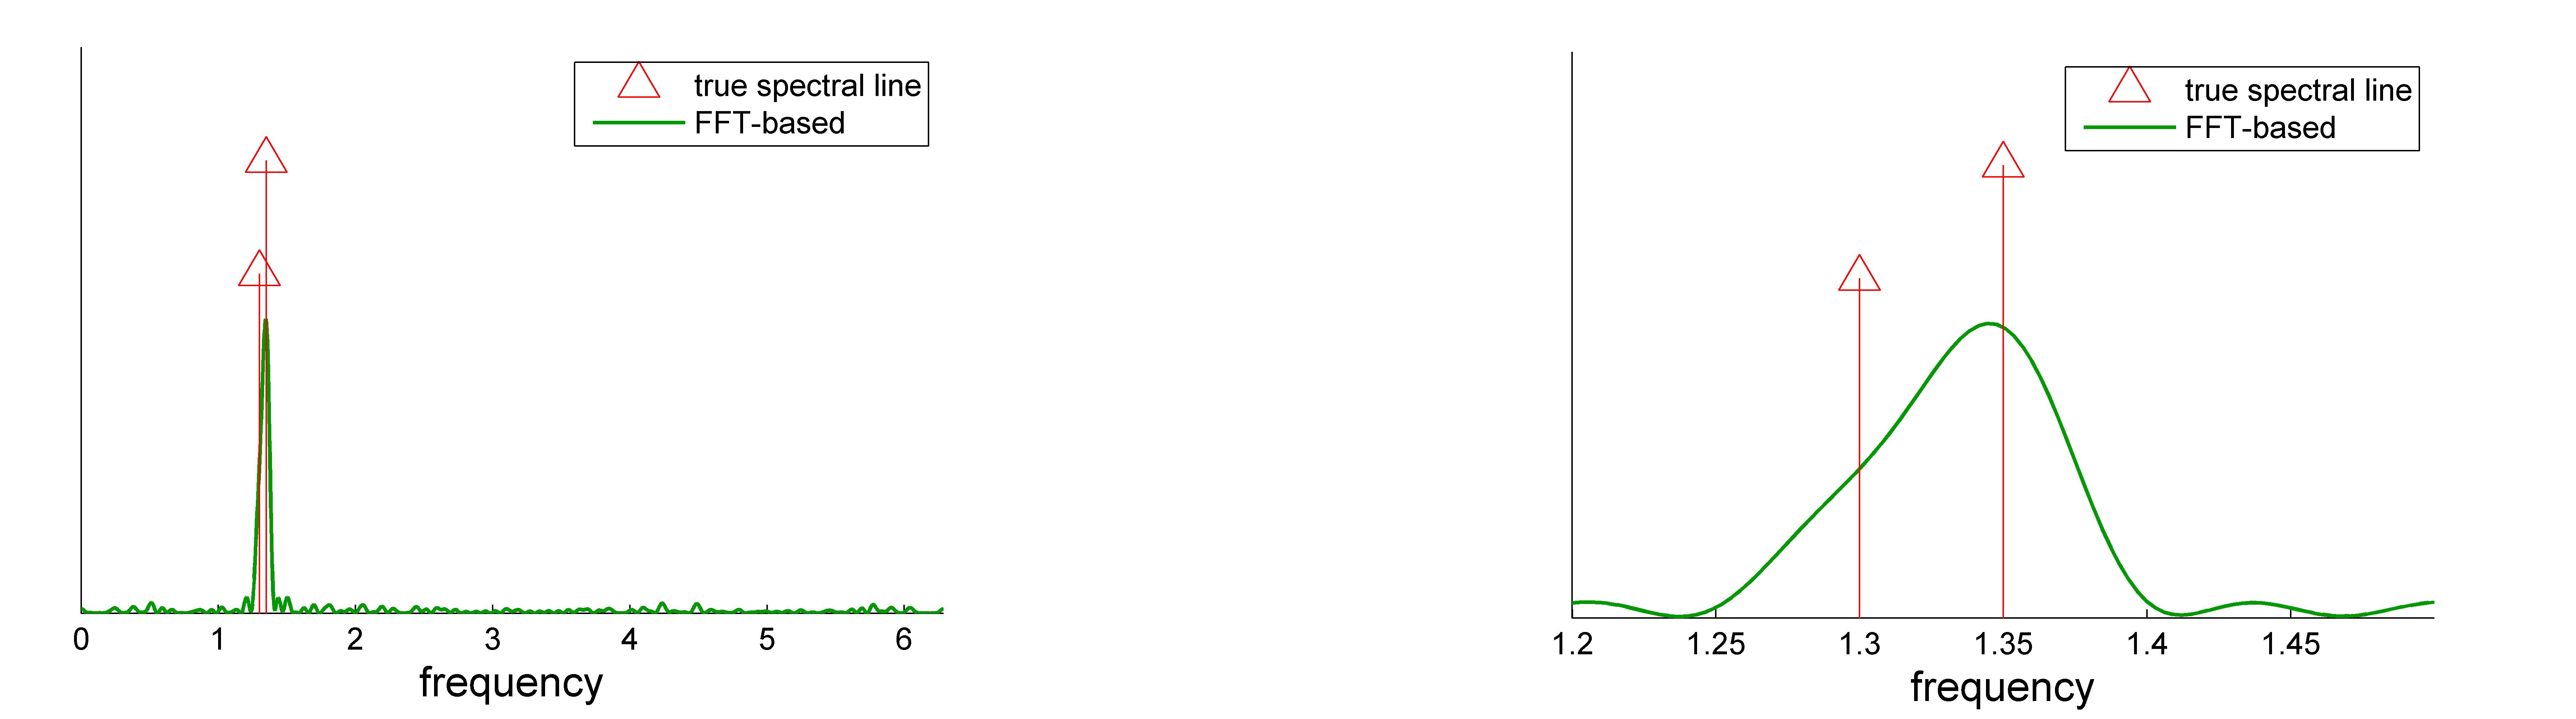
Using the above example, we pad up  by adding zeros. The corresponding
FFT-based spectrum is shown in the following figures.
Rudimentary code is displayed as a demonstration. A file to reproduce the following results can
be downloaded. Alternative matlab build-in routines for periodograms are periodogram, pwelch, etc.
by adding zeros. The corresponding
FFT-based spectrum is shown in the following figures.
Rudimentary code is displayed as a demonstration. A file to reproduce the following results can
be downloaded. Alternative matlab build-in routines for periodograms are periodogram, pwelch, etc.
 |