% maximum entropy spectrum and Burg spectrum
me_spectrum=me(R,A,B,th);
plot(th,me_spectrum);
me_burg=pburg(y,5,th);
hold on;
plot(th,me_burg);
Maximum entropy spectrum
The entropy of a probability distribution function  with
with  ,
,
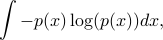
quantifies the uncertainty of the corresponding random variable.
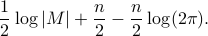
When is a multi-dimensional Gaussian distribution with zero mean and covariance matrix
 , the entropy becomes
For a zero-mean stationary Gaussian process  , corresponding to
infinite-sized Toeplitz structured covariance, the entropy “diverges”. Thus, one uses instead the ‘‘entropy rate". Let
, corresponding to
infinite-sized Toeplitz structured covariance, the entropy “diverges”. Thus, one uses instead the ‘‘entropy rate". Let  be a
be a  dimensional principle sub-matrix of the
covariance matrix
dimensional principle sub-matrix of the
covariance matrix
![T_{N-1}=left[ begin{array}{cccc} r(0) & r(1) & ldots & r(N-1) r(-1) & r(0) & ldots & r(N-2) vdots & vdots & ddots & cdots r(-N+1) & r(-N+2) & r(-1) & r(0) end{array} right],](eqs/2065058937-130.png)
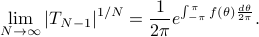
Then the entropy rate is

The limit of  converges to the optimal one-step prediction error variance, and from the Szeg
 -Kolmogorov formula
Given state statistics, the maximum entropy power spectrum is

The solution to this problem (see [2]) is

where
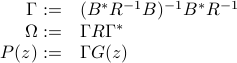
and  is the input-to-state filter defined above.
Then the maximum entropy spectrum is precisely the solution given above.
is the input-to-state filter defined above.
Then the maximum entropy spectrum is precisely the solution given above.
This formula subsumes the classical Burg method/AR modeling where the  is a Toeplitz matrix and
is lag-delay filter bank.
is a Toeplitz matrix and
is lag-delay filter bank.
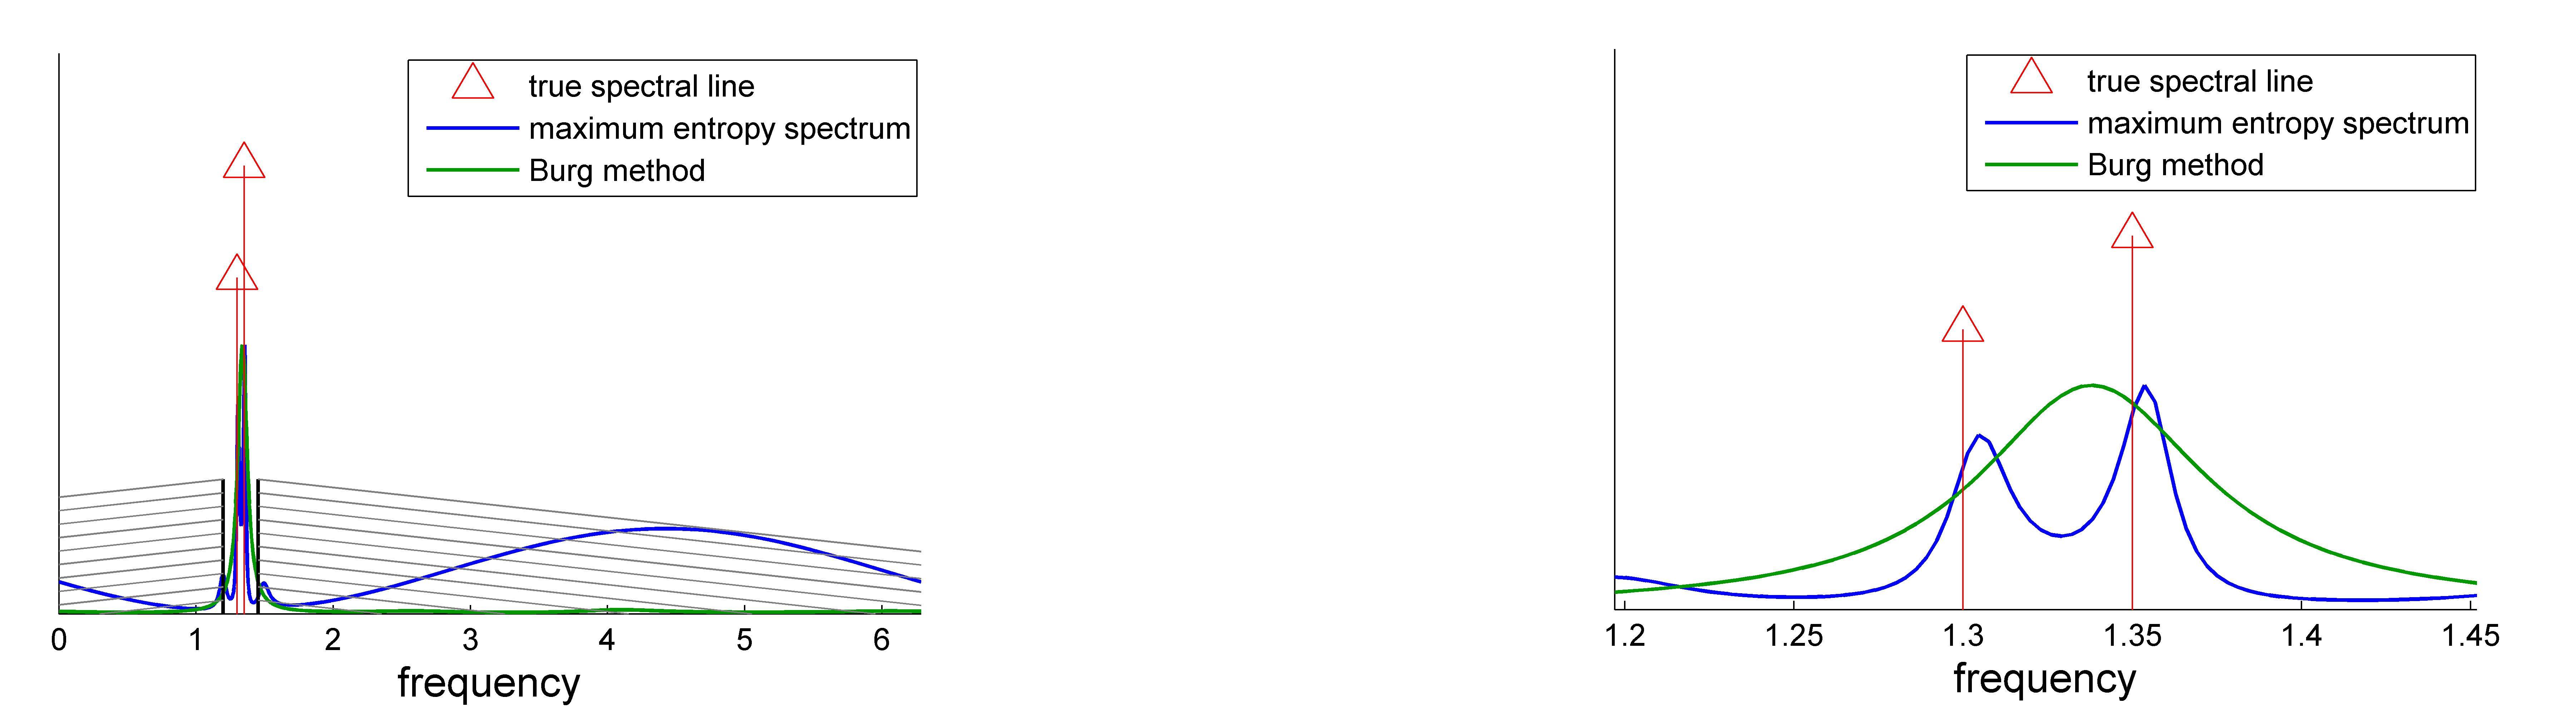
The maximum entropy spectrum is obtained using the routine me.m. For the example discussed above, the maximum entropy spectrum is shown in blue. There are two peaks detected inside the window. Burg's spectrum is shown in green. The resolution of Burg's solution is not sufficient to distinguish the two peaks.
 |